
Believing and Belonging: Americans' Religious Practices and Their Trust in Government
Hwayong Shin, Weidenbaum Center Postdoctoral Fellow in Survey Research
July 17, 2026
Questions about the existence of God have occupied human thought for centuries, much as questions about individuals’ relationship to politics. For much of history—from Ancient Egypt and Imperial China to medieval Europe—religion served as a key source of political legitimacy, providing governments with moral authority and public support (Grzymala-Busse 2020; Hill et al. 2013; Zhao 2009). Although modern societies increasingly separated religion from politics and political institutions have become more secular (Brown 2019), religion continues to play and important role in our political life.
In the United States, religion remains deeply intertwined with politics. Recent research shows that Americans’ religiosity is closely linked to their political orientations, such as partisanship (Campbell et al. 2018). The relationship between religion and politics may also vary across age groups, as religious identities evolve over the life course and can themselves be shaped by politics (Bengston et al. 2015; Margolis 2018) At the same time, the country's religious landscape has changed with the rise of religious “nones”—people who do not identify with any religion but pray, believe in God, or engage in religious practices, and who exhibit distinct political orientations (Levin et al. 2022; Schwadel 2020). These developments raise an important question: how religious are Americans, and how does religiosity shape political attitudes in contemporary America?
One of the long-held questions in the study of religion and politics is whether religiosity shapes trust in government. The answer, surprisingly, is far from settled. Some scholars argue—and present evidence—that religiosity can discourage trust in government because many major religions emphasize loyalty to one's own community or encourage believers to solely place their trust in God (Berggren & Bjørnskov 2009; Valente & Okulicz-Kozaryn 2021). Other scholars reach an opposite conclusion, finding that secularization is associated with lower institutional trust—atheists and nonreligious individuals tend to express lower trust in government—and that religiosity is positively associated with trust in government (Creel 2021; Godefroidt et al. 2017; Kasselstrand et al. 2017).
Part of the reason for these mixed findings may be that religiosity is not a single-dimensional construct (Huber & Huber 2012; Joseph & DiDuca 2007). People may practice their faith in different ways, for instance, by attending religious services or praying privately (Gemar 2024; Valente & Okulicz-Kozaryn 2021). These different expressions of religiosity may carry different implications for political trust. Existing research suggests that communal and private religious practices are associated with trust in government in different ways. Attending religious services—a social or communal form of practice—has been linked to trust in institutions or other people, whereas praying—an individual or private form of practice—has been associated with lower trust (Gemar 2024; Valente & Okulicz-Kozaryn 2021). Understanding these different dimensions of religiosity is important for understanding how religion shapes Americans' political life and their trust in government today.
Data from the Weidenbaum Center Survey (WCS) offer new insights into Americans’ religious and political lives by addressing two broad questions. First, how religious are Americans today, and how does religiosity vary across age and partisan groups? Waves 1–8 of the WCS, conducted between 2023 and 2026, are used to answer this question. Second, how are different forms of religiosity associated with trust in government, and do these relationships differ across age and partisan groups? To answer this question, this article leverages Waves 6–8 of the WCS, which included measures of trust in government, conducted between 2025 and 2026. The findings shed new light on how both believing—praying privately—and belonging—attending religious services—relates to political trust in contemporary religious landscape of the United States.
How Religious Are Americans Today?
To examine Americans’ religious affiliation, respondents were asked to identify their current religion, if any. The distribution of religious affiliation remained quite stable between late 2023 and early 2026. Roughly one-third of Americans were religiously unaffiliated, identifying as atheist, agnostic, or “nothing in particular.” The remaining two-thirds identified with a religion, including Protestant, Roman Catholic, Mormon, Eastern or Greek Orthodox, Jewish, Muslim, Buddhist, Hindu, or another religion. These patterns are largely consistent with Gallup’s findings, which identify Protestants and Catholics as the largest religious groups in the United States, although the WCS estimates a larger share of religiously unaffiliated Americans than Gallup (22% in 2024; Jones 2025).
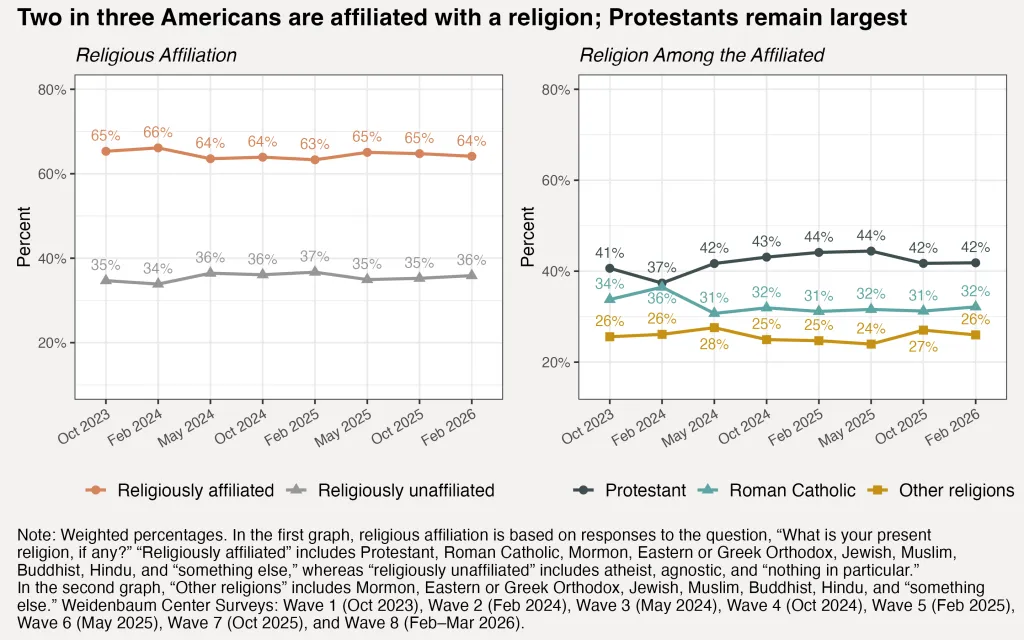
Among those who were religiously affiliated, Protestants consistently made up the largest group, accounting for about 40% of all affiliated respondents (37–44%). Roman Catholics were the second-largest group, comprising roughly 30% (31–36%). Each of the remaining religious traditions—including Mormon, Eastern or Greek Orthodox, Jewish, Muslim, Buddhist, Hindu, and other religions—represented less than 5% of affiliated respondents individually. Together, however, these groups accounted for about one-quarter of religiously affiliated Americans (24–28%).
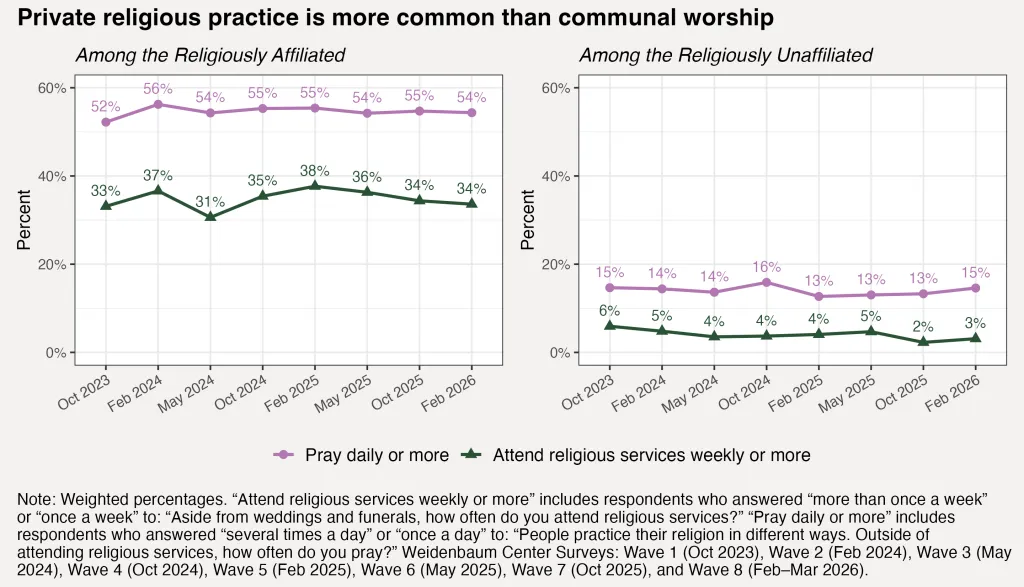
How often do Americans practice religion, either privately through prayer or socially by attending religious services? Among religiously affiliated Americans, about half (52–56%) pray at least once a day, while roughly one-third (31–38%) attend religious services at least once a week. Consistent with recent discussions of religious “nones” in the United States, some religiously unaffiliated Americans also engage in religious practices. Between 13% and 16% report praying at least once a day, while 2% to 6% attend religious services at least once a week.
When religious affiliation and practices are examined across age groups, the youngest (under 30) and oldest (60 or above) cohorts of Americans are most likely to have a religious affiliation (64% and 71%, respectively) compared with those in the middle age groups. The oldest cohort reports the highest rate of daily prayer (47%), whereas the youngest cohort has the largest share attending religious services weekly or more (32%). This pattern is consistent with recent findings that Americans who leave the religion in which they were raised tend to do so around age 30 (Alper et al. 2025), which may help explain the lower levels of religious affiliation and practice among adults ages 30–44.
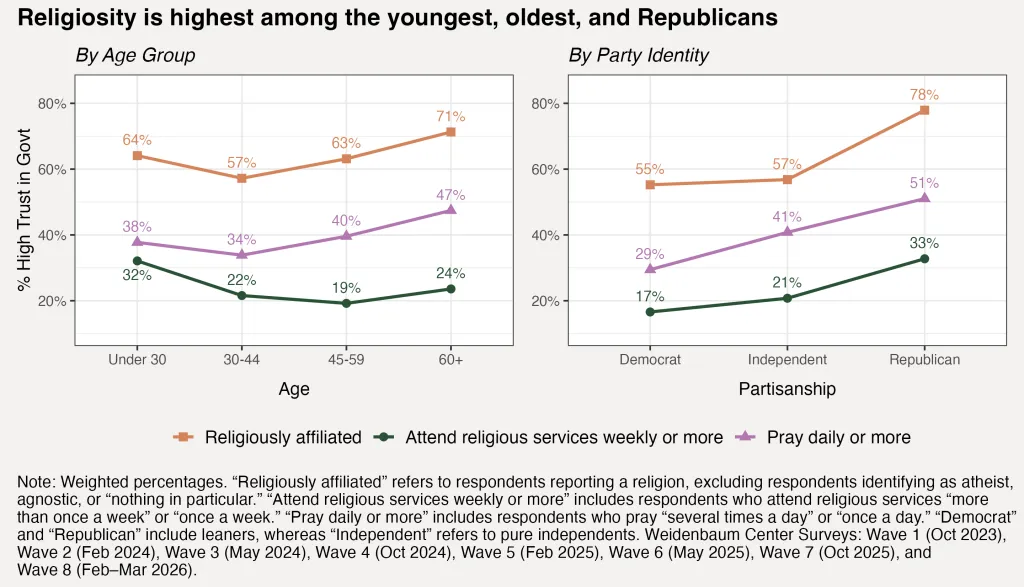
When partisan differences are considered, Republicans are the most religious across all three aspects of religiosity, reporting the highest rates of religious affiliation (78%), daily prayer (51%), and regular attendance at religious services (33%). Independents fall in the middle, while Democrats are the least religious in terms of both affiliation and religious practice. These patterns are consistent with recent research showing that Republicans are more religious than Democrats across multiple dimensions of religiosity (Diamant 2025).
How Are Social and Private Religious Practices Linked to Trust in Government?
Trust in federal government—the extent to which respondents trust the federal government to do what is right—is examined using Waves 6-8 of WCS. Prior research comparing social and private forms of religious practices has found contrasting relationships with institutional and social trust. Specifically, attending religious services has been associated with higher levels of trust, whereas private prayer has been linked to lower trust in democratic institutions (e.g., Congress), religious institutions, and interpersonal or generalized trust (Gemar 2024; Valente & Okulicz-Kozaryn 2021). Do these two forms of religious practices exhibit similar or divergent relationships with trust in the federal government?
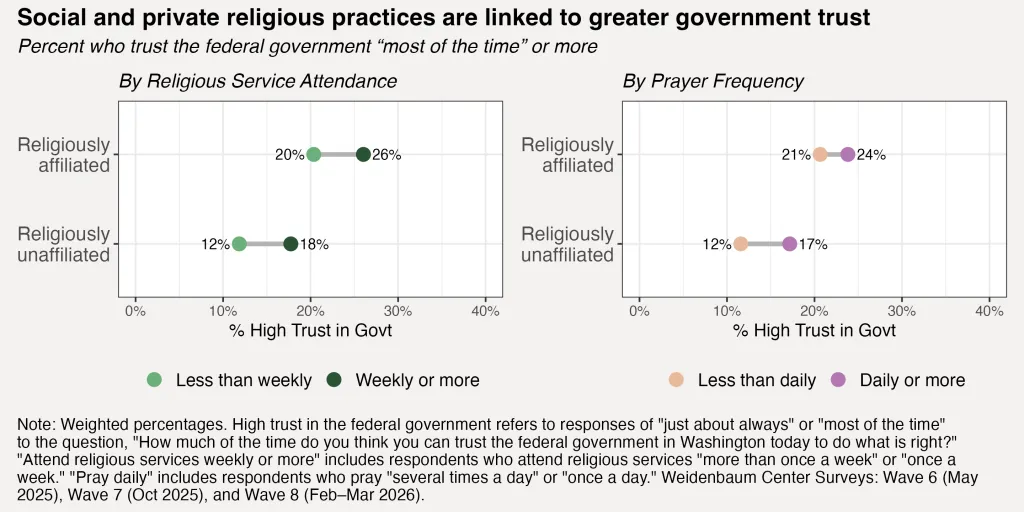
In the graphs below, high trust in the federal government is defined as respondents reporting that they trust the federal government to do what is right “just about always” or “most of the time.” Different from previous findings for institutional trust and generalized trust, trust in the federal government is positively associated with both social and private religious practices. Among religiously affiliated Americans, 26% of those who attend religious services at least weekly report high trust in the federal government, compared with 20% of those who attend less frequently. Likewise, 24% of those who pray daily or more report high trust, compared with 21% of those who pray less often. These relationships are similarly found among religiously unaffiliated Americans: weekly religious service attendance is associated with a 6-percentage-point increase in high trust (12% vs. 18%), while daily prayer is associated with a 5-percentage-point increase (12% vs. 17%).
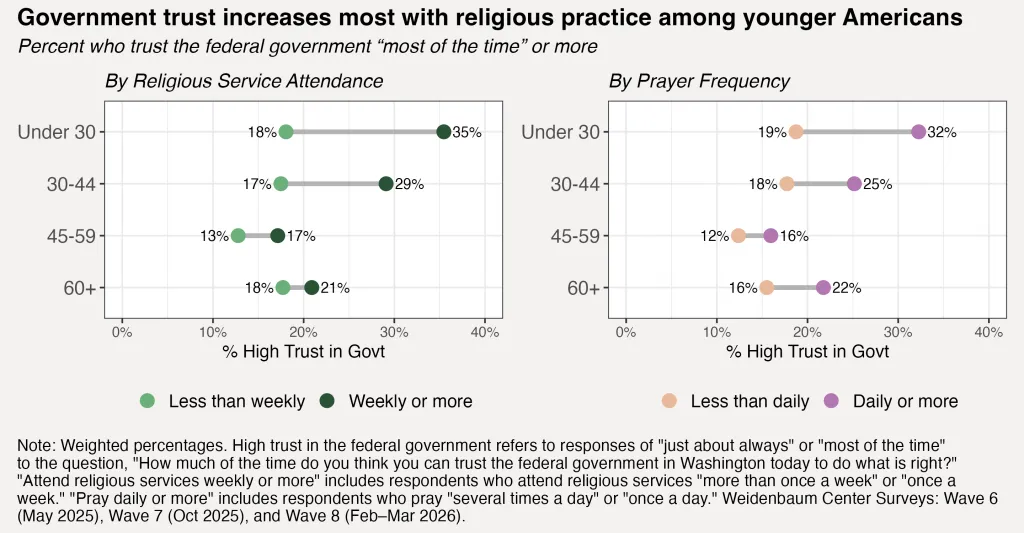
The relationship between religious practice and trust in the federal government is broadly consistent across age groups, although its strength varies. Because some religiously unaffiliated Americans also engage in religious practices, the analysis below compares respondents by their religious practices regardless of religious affiliation. Across all age cohorts, both regular religious service attendance and daily prayer are associated with higher levels of trust in the federal government. The association is strongest among the youngest Americans (under 30): weekly religious service attendance is associated with a 17-percentage-point increase in high trust (18% vs. 35%), while daily prayer is associated with a 13-percentage-point increase (19% vs. 32%). The positive relationship also holds among older age groups, although the magnitude of the differences is smaller.
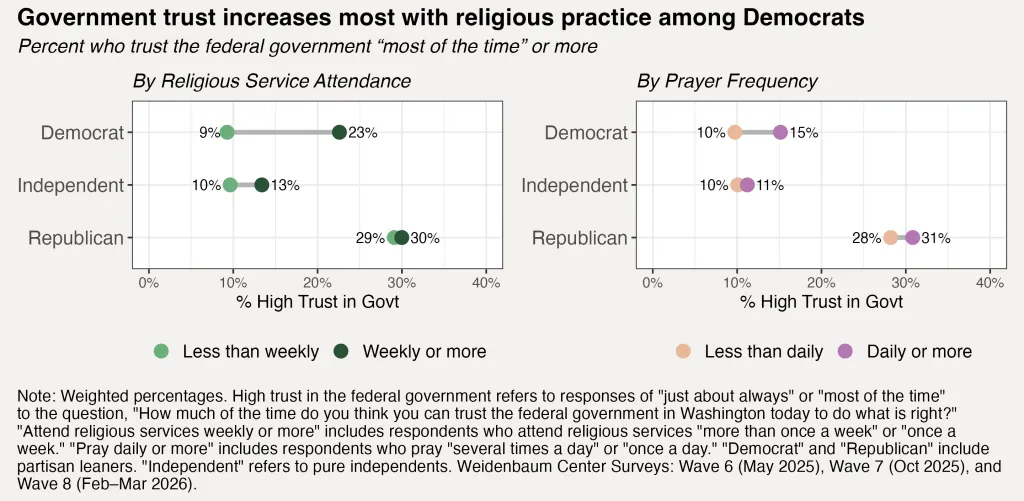
When the relationship between religious practice and trust in the federal government is examined by partisanship, Democrats stand out as the group for whom religious practice makes the greatest difference. Among Democrats, weekly religious service attendance is associated with a 14-percentage-point increase in high trust in the federal government (23% vs. 9%), while daily prayer is associated with a 5-percentage-point increase (15% vs. 10%). This finding is noteworthy given that the surveys were conducted under a Republican administration. In contrast, differences by religious practice are more modest among independents and Republicans. Nevertheless, the overall pattern remains similar across partisan groups, with more frequent religious practice associated with higher trust in the federal government.
In Closing
The findings reveal that a majority of Americans are affiliated with a religion and that more than half of them regularly engage in religious practices. At the same time, even some Americans without a religious affiliation continue to pray or participate in other religious practices, reflecting the growing presence of religious “nones.” Furthermore, religiosity is highest among the youngest and oldest Americans, as well as Republicans, as reflected in religious affiliation and both social and private religious practices. Contrary to some previous research, the WCS data show that both believing and belonging—praying privately and attending religious services—are positively associated with trust in the federal government. These relationships are particularly strong among younger Americans and Democrats.
Although the current data cannot fully explain why both social and private religious practices are associated with greater trust in the federal government, the findings highlight an important pattern: religious practice is positively associated with trust even among Democrats, despite a Republican administration during the survey period. Taken together with previous research showing that politics can shape Americans’ religious identities (Margolis 2018) and that religion and politics mutually shape one another (Campbell et al. 2018), these findings underscore the close and enduring relationship between religion and politics in the United States. As the religious landscape continues to evolve, understanding both believing and belonging will remain essential for understanding Americans’ political attitudes and trust in government.
Author: Hwayong Shin is a postdoctoral fellow at the Weidenbaum Center on the Economy, Government, and Public Policy at Washington University in St. Louis.
Acknowledgement: I am grateful to Taylor Carlson, Kristin Henningfeld, and Elizabeth Larson for helpful comments.
Bibliography
Alper, B. A., Tevington, P., Kallo, A., & Diamant, J. (2025, December 15). Why Do Some Americans Leave Their Religion While Others Stay? Pew Research Center. https://www.pewresearch.org/religion/2025/12/15/why-do-some-americans-leave-their-religion-while-others-stay/
Berggren, N., & Bjørnskov, C. (2009). Does Religiosity Promote or Discourage Social Trust? Evidence from Cross-Country and Cross-State Comparisons (SSRN Scholarly Paper No. 1478445). Social Science Research Network. https://doi.org/10.2139/ssrn.1478445
Brown, D. (2019). Measuring Long-Term Patterns of Political Secularization and Desecularization: Did They Happen or Not? Journal for the Scientific Study of Religion, 58(3), 570–590. https://doi.org/10.1111/jssr.12610
Campbell, D. E., Layman, G. C., Green, J. C., & Sumaktoyo, N. G. (2018). Putting Politics First: The Impact of Politics on American Religious and Secular Orientations. American Journal of Political Science, 62(3), 551–565. https://doi.org/10.1111/ajps.12365
Creel, N. (2021). In God we trust…and Caesar too? Evaluating the link between religiosity and trust in government. International Journal of Sociology and Social Policy, 42(9–10), 795–815. https://doi.org/10.1108/IJSSP-06-2021-0156
Diamant, J. (2025, November 20). Religiousness varies a lot by race among Democrats, relatively little among Republicans. Pew Research Center. https://www.pewresearch.org/short-reads/2025/11/20/religiousness-varies-a-lot-by-race-among-democrats-relatively-little-among-republicans/
Gemar, A. (2024). Institutional Trust, Spirituality, and Religious Practice in the United States. Social Sciences, 13(1), 67. https://doi.org/10.3390/socsci13010067
Godefroidt, A., Langer, A., & Meuleman, B. (2017). Developing political trust in a developing country: The impact of institutional and cultural factors on political trust in Ghana. Democratization, 24(6), 906–928. https://doi.org/10.1080/13510347.2016.1248416
Grzymala-Busse, A. (2020). Beyond War and Contracts: The Medieval and Religious Roots of the European State. Annual Review of Political Science, 23(Volume 23, 2020), 19–36. https://doi.org/10.1146/annurev-polisci-050718-032628
Huber, S., & Huber, O. W. (2012). The Centrality of Religiosity Scale (CRS). Religions, 3(3), 710–724. https://doi.org/10.3390/rel3030710
Jones, J. M. (2025, April 17). Religious Preferences Largely Stable in U.S. Since 2020. Gallup.Com. https://news.gallup.com/poll/659339/religious-preferences-largely-stable-2020.aspx
Joseph, S., & DiDuca, D. (2007). The Dimensions of Religiosity Scale: 20-item self-report measure of religious preoccupation, guidance, conviction, and emotional involvement. Mental Health, Religion & Culture, 10(6), 603–608. https://doi.org/10.1080/13674670601050295
Hill, J. A., Jones, P., & Morales, A. J. (Eds.). (2013). Experiencing Power, Generating Authority: Cosmos, Politics, and the Ideology of Kingship in Ancient Egypt and Mesopotamia. University of Pennsylvania Museum of Archaeology and Anthropology. https://doi.org/10.2307/j.ctt5hjkfv
Kasselstrand, I., Couse, T., & Sanchez, S. (2017). Institutional Confidence in the United States: Attitudes of Secular Americans. Secularism and Nonreligion, 6(0). https://doi.org/10.5334/snr.80
Levin, J., Bradshaw, M., Johnson, B. R., & Stark, R. (2022). Are Religious “Nones” Really Not Religious?: Revisiting Glenn, Three Decades Later. Interdisciplinary Journal of Research on Religion, 18, 1.
Margolis, M. F. (2018). How Politics Affects Religion: Partisanship, Socialization, and Religiosity in America. The Journal of Politics, 80(1), 30–43. https://doi.org/10.1086/694688
Schwadel, P. (2020). The Politics of Religious Nones. Journal for the Scientific Study of Religion, 59(1), 180–189. https://doi.org/10.1111/jssr.12640
Valente, R. R., & Okulicz-Kozaryn, A. (2021). Religiosity and Trust: Evidence from the United States. Review of Religious Research, 63(3), 343–379. https://doi.org/10.1007/s13644-020-00437-8
Zhao, D. (2009). The Mandate of Heaven and Performance Legitimation in Historical and Contemporary China. American Behavioral Scientist, 53(3), 416–433. https://doi.org/10.1177/0002764209338800
Data
The Weidenbaum Center Survey (WCS) was conducted by Washington University in St. Louis’s Weidenbaum Center on the Economy, Government, and Public Policy through the survey firm YouGov on Oct 16–24, 2023 (Wave 1), Feb 15–26, 2024 (Wave 2), May 15–28, 2024 (Wave 3), Oct 15–23, 2024 (Wave 4), Feb 14–24, 2025 (Wave 5), May 15–26, 2025 (Wave 6), October 15–28, 2025 (Wave 7), February 18 – March 2, 2026 (Wave 8). The sample size for each wave was: Wave 1 (n = 3,281), Wave 2 (n = 3,044), Wave 3 (n = 3,182), Wave 4 (n = 3,248), Wave 5 (n = 3,230), Wave 6 (n = 3,535), Wave 7 (n = 3,029), and Wave 8 (n = 3,367). However, the sample size used in each analysis may be smaller because respondents who did not answer the relevant survey questions are excluded. Because there was an oversample of African Americans, the weighted percentages were presented in the results. For partisan identity, “Democrats” include individuals identifying as Strong Democrat, Not very strong Democrat, or Lean Democrat; “Republicans” include those identifying as Strong Republican, Not very strong Republican, or Lean Republican; and “Independents” refer to pure independents who identified as Independent without partisan leaning.